This post was written by Nate Johnson, a student in the 5-year Accelerated PE/MBA program. Nate also serves as Vice-President of the OU Student Chapter of the Society of Petroleum Engineers. This blog is about his summer in Pittsburg with EQT – which included some extracurricular activities like seeing the Penguins win the Stanley Cup.
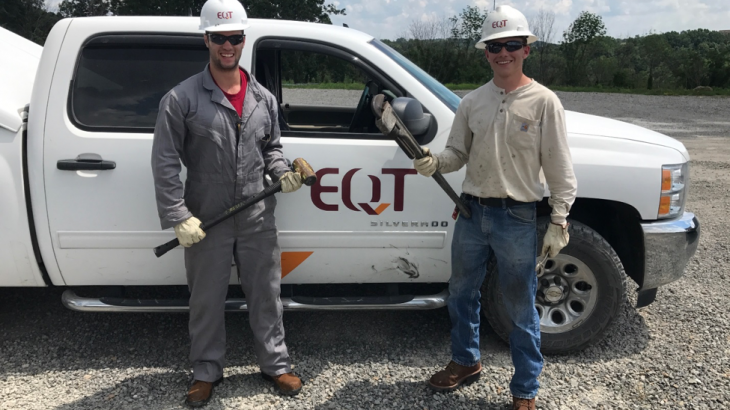
 This summer I got the opportunity to work for America’s largest natural gas producer, EQT. I worked in downtown Pittsburgh as a production engineer, but I got ample time in the field working with plungers; the cornerstone of dry gas artificial lift. Over the summer, my main project involved getting familiar with a big data processing software called Spotfire. I also got involved in a few of the full-time engineers’ projects during some of my free time, and even attended a Stanley Cup Finals game to watch the Penguins win the cup.
We’ll start with my experience in Spotfire since it was the focus of my summer. This software makes it an absolute breeze to manipulate data from various sources and perform in-depth analysis. Once I brushed up on some basic coding skills, I was able to integrate data from two different sources that polled live data from EQT’s wells. I then merged all of this data into one Spotfire file and efficiently presented a live view and one month history of all plungers operated by EQT. Spotfire really makes it easy to visualize and quickly alter data. Once I realized how easily I could visual data with Spotfire, I completely turned my back on excel. I only wish I could get back those endless hours of struggling to make excel figures look exactly how I needed. 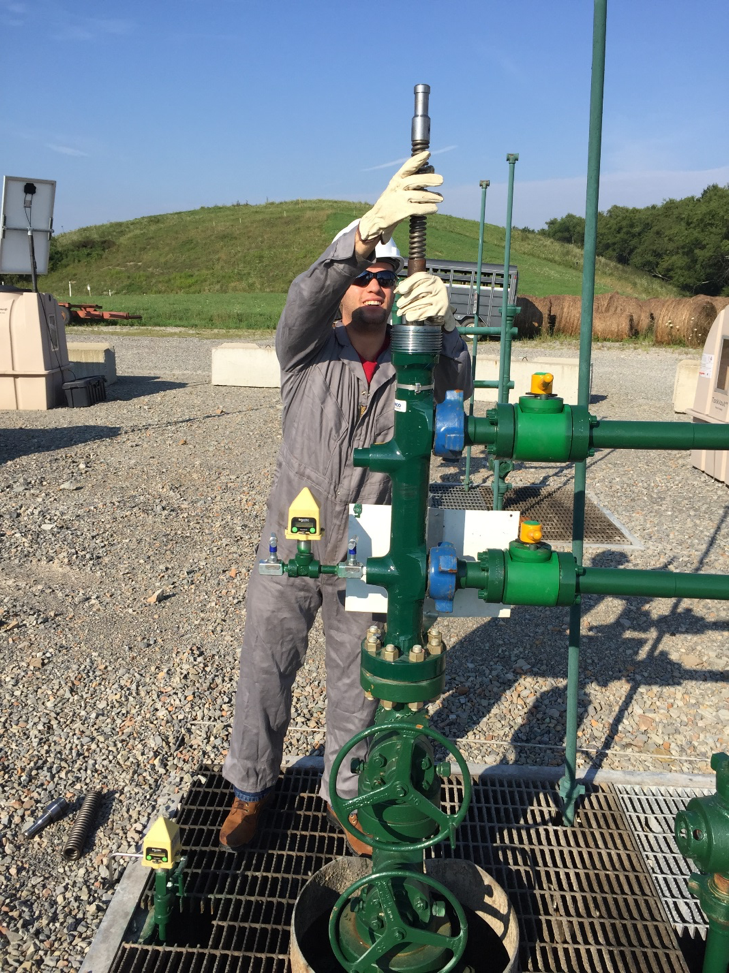 Once I got the hang of how to code through this program, I was even able to provide an analysis of the company’s flowback procedures and more.
One of my cooler side projects this summer was to use GIS to map out back-off data. Back-off is how EQT engineers refer to the loss of production volumes due to a spike in line pressure. Specifically, we were interested in how it is caused by bringing new, large volumes of gas from a well into a system, which reduces the production volumes of older wells. GIS was an extremely useful tool in creating a heat map of this back-off effect throughout one of EQT’s gathering systems. This heat map will help EQT plan for production volumes, and help guide them in finding a more permanent solution to back-off. Doing this project was extremely satisfying because every engineer in the group got very excited to be able to quantify and visualize the back-off effect. The map even made it to the Director of Scheduling and Transportation within a day. Even though I learned a ton throughout all of these projects, there was one experience that trumps the others.
After a philanthropy river boat trip hosted by EQT, I got to meet the CEO and President of Production of EQT. Just meeting them was certainly not the highlight. The President has a passion for darts, so he grabbed another intern and challenged me and the CEO to a game. I knew that if I wanted to have a

ny future at this company, then I better be sure the CEO wins this game. Luckily, I’ve spent the past three years casually playing darts between classes, so the CEO loved having me as his teammate. The highlight of the internship was definitely helping the CEO win every game of darts that night.
Overall, I had a great experience with EQT. I was glad to get a variety of fun and challenging experiences. The experience I got with Spotfire is transferrable to any company for any data, so thoseanalysis skills will be invaluable for me in the future. Pittsburgh doesn’t have the best reputation, but I think it’s a great up and coming city with a lot to offer; especially after back-to-back Stanley Cup wins.